

SPECIAL REPORT
This exclusive North American article will be broken into a series of five consecutive posts providing our readers with useful market edges and insights that are unprecedented amoung peers, into the empirical patterns behind historical and "possibly future stock market crashes." The article is sourced and supported by the author's research; having first been published earlier in renowned European journals. Applying such knowledge wisely, thereby optimizes the chances for better decisions and increased wealth - First Financial Insights, Toronto, April 2015
New stock market crash, a pattern?
Part 2 - The S-Curve of Transition
the demographic transition and the transition from coal to natural gas which caused transition in the use of energy. A transition process is not fixed from the start because during the transition processes will adapt to the new situation. A transition is not dogmatic.
Can We More To A Sustainable System?
Four transition phases -
In general transitions can be seen to go through the S curve and we can distinguish four phases (see fig. 1):
1. a pre development phase of a dynamic balance in which the present status does not visibly change
2. a take off phase in which the process of change starts because of changes in the system
3. an acceleration phase in which visible structural changes take place through an accumulation of socio cultural, economical, ecological and institutional changes influencing each other; in this phase we see collective learning processes, diffusion and processes of embedding
4. a stabilization phase in which the speed of sociological change slows down and a new dynamic balance is achieved through learning
A product life cycle also goes through an S curve. In that case there is a fifth phase:
5. the degeneration phase in which cost rises because of over capacity and the producer will finally withdraw from the market.
The S curve of a transition:
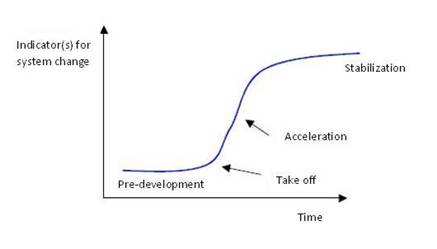
<< Fig Four phases in a transition best visualized by means of an S curve.>>
NEXT Part #3 - Three Drastic Transitions

ABOUT ARTICLE
Wim Grommen writes: This paper advances a hypothesis of the end of the third industrial revolution and the beginning of a new transition. Every production phase or civilization or human invention goes through a so- called transformation process. Transitions are social transformation processes that cover at least one generation. In this paper I will use one such transition to demonstrate the position of our present civilization. When we consider the characteristics of the phases of a social transformation we may find ourselves at the end of what might be called the third industrial revolution. The paper describes the four most radical transitions for mankind and the effects for mankind of these transitions: the Neolithic transition, the first industrial revolution, the second industrial revolution and the third industrial revolution.
The article “A new stock market crash, a pattern?”, in dutch "Nieuwe beurskrach, een wetmatigheid?” was published in a magazine “Tijdschrift voor economisch onderwijs” (magazine for economical education), a monthly publication of the VECON, A union of teachers in economic and social subjects in theNetherlands
NEXT Part #3 - Three Drastic Transitions
ABOUT ARTICLE
Wim Grommen writes: This paper advances a hypothesis of the end of the third industrial revolution and the beginning of a new transition. Every production phase or civilization or human invention goes through a so- called transformation process. Transitions are social transformation processes that cover at least one generation. In this paper I will use one such transition to demonstrate the position of our present civilization. When we consider the characteristics of the phases of a social transformation we may find ourselves at the end of what might be called the third industrial revolution. The paper describes the four most radical transitions for mankind and the effects for mankind of these transitions: the Neolithic transition, the first industrial revolution, the second industrial revolution and the third industrial revolution.
The article “A new stock market crash, a pattern?”, in dutch "Nieuwe beurskrach, een wetmatigheid?” was published in a magazine “Tijdschrift voor economisch onderwijs” (magazine for economical education), a monthly publication of the VECON, A union of teachers in economic and social subjects in the


